BACKGROUND
The GCP logging agent uses modified fluentd, which allows us to do either unstructured logging or structured logging. The structured logging relies on JSON payload while the unstructured logging can be any texts. The advantage of structured logging is we can leverage log features in GCP Log Viewer.
UNSTRUCTURED LOGGING
Installing the unstructured logging is straightforward:-
curl -sSO https://dl.google.com/cloudagents/add-logging-agent-repo.sh
sudo bash add-logging-agent-repo.sh
sudo yum install -y google-fluentd
sudo yum install -y google-fluentd-catch-all-config
To capture a specific log file, create a config file under /etc/google-fluentd/config.d dir, ex:-
# /etc/google-fluentd/config.d/test.conf

<source>
  @type tail
  format none
  path /tmp/test.log
  pos_file /var/lib/google-fluentd/pos/test.pos
  tag test
  read_from_head true
</source>
Finally, start the service.
sudo systemctl restart google-fluentd
format none indicates no additional processing will be done. So, the logs appear as “flat” texts.
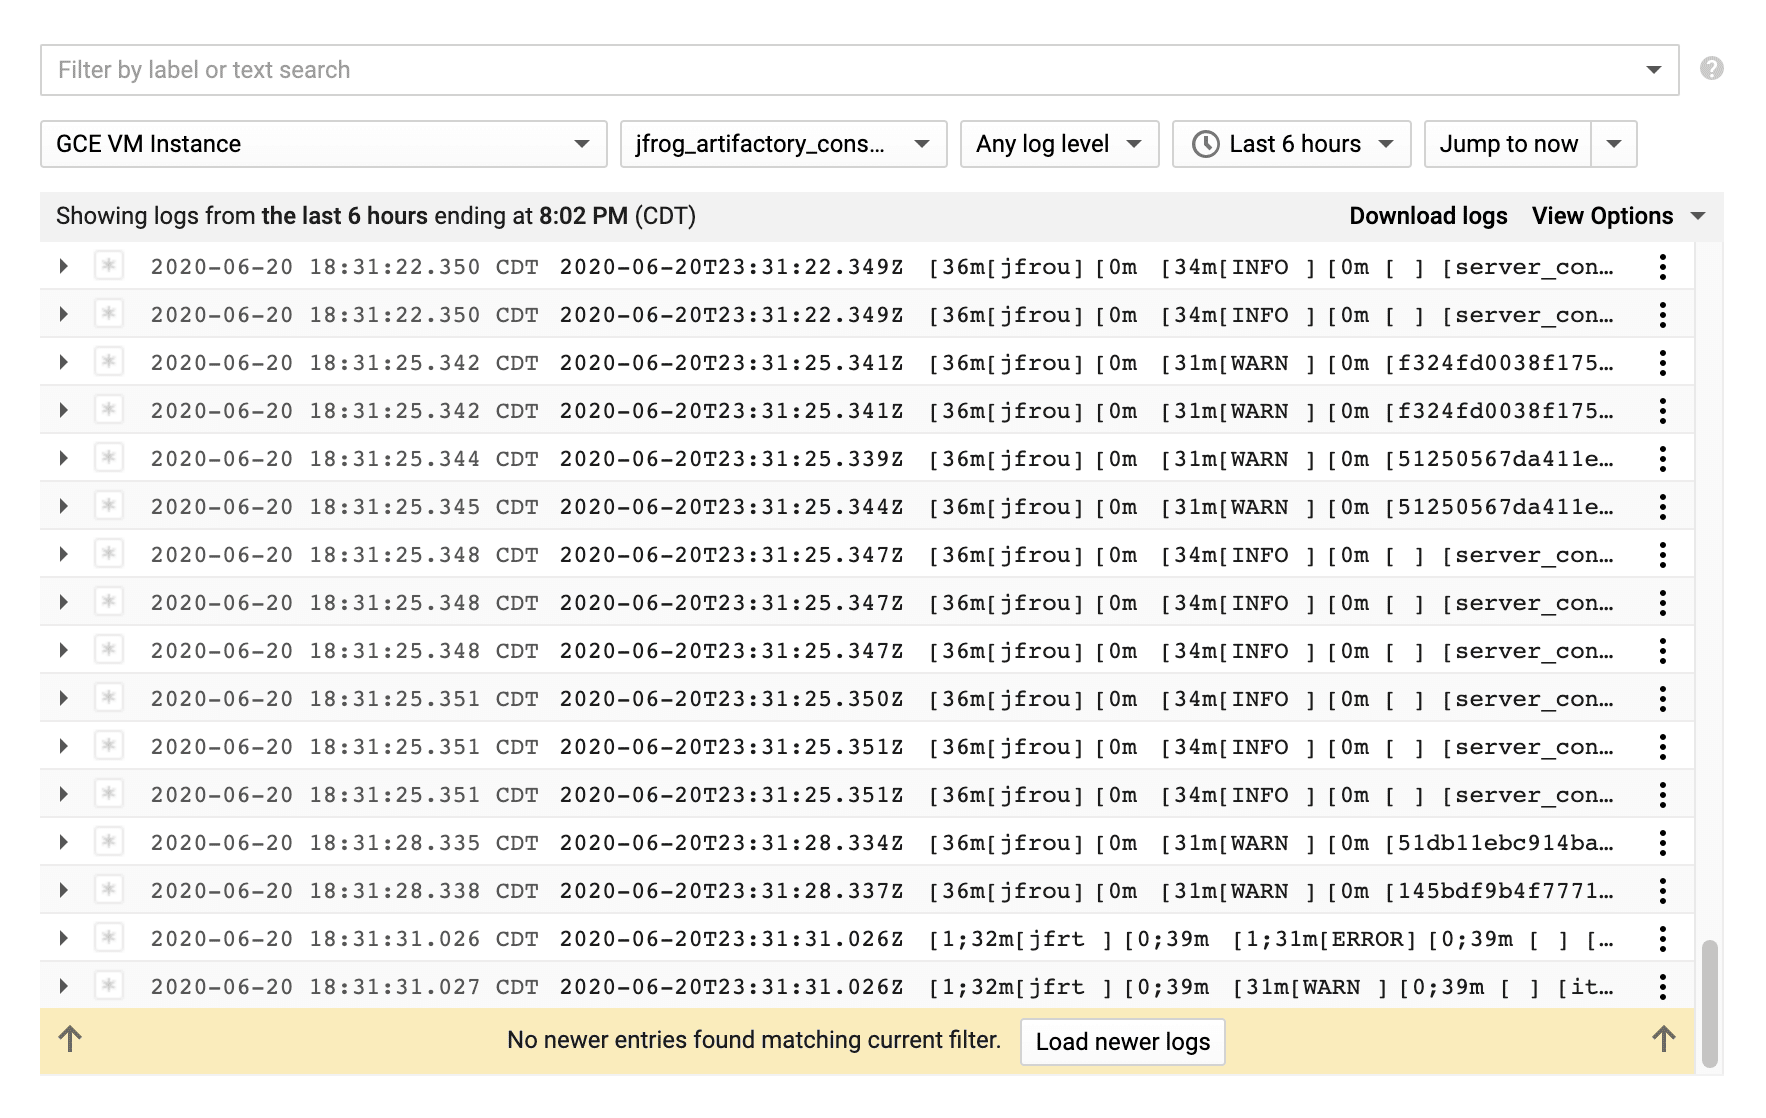
Using unstructured logging, the severity indicator never gets set, so we lose the color coding and filtering capabilities in GCP Log Viewer, ex:-
JOURNEY TO STRUCTURED LOGGING
Installing structured logging is very similar to unstructured logging with one small change:-
curl -sSO https://dl.google.com/cloudagents/add-logging-agent-repo.sh
sudo bash add-logging-agent-repo.sh
sudo yum install -y google-fluentd
sudo yum install -y google-fluentd-catch-all-config-structured
Create a config file, but the content is slightly more complicated depending on how granular we want to capture the structured log data:-
# /etc/google-fluentd/config.d/test.conf

<source>
  @type tail
  format multiline
  format_firstline /\d{4}-\d{2}-\d{2}T\d{2}:\d{2}:\d{2}.\d{3}Z/
  format1 /^(?<time>[^ ]*) \[(?<severity>[^\] ]*).*?\] - (?<message>.*)$/
  time_format %Y-%m-%dT%H:%M:%S.%NZ
  path /tmp/test.log
  pos_file /var/lib/google-fluentd/pos/test.pos
  tag test
  read_from_head true
</source>
Given the unstructured logs may span multiple lines, multiline parser is ideal. Here’s an example of logs that span multiple lines:-
2020-06-20T20:00:00.107Z [INFO ] - Storage garbage collector report:
Number of binaries:      0
Total execution time:    4 millis
2020-06-20T20:14:25.525Z [INFO ] - Starting to cleanup incomplete Release Bundles
2020-06-20T20:14:25.533Z [WARN ] - Finished incomplete Release Bundles cleanup
2020-06-20T20:31:00.167Z [ERROR ] - Start cleaning expired sessions
format_firstline indicates when to stop parsing when scanning through multiple lines.
There can be multiple format[N], depending on how granular we want to capture the structured log data.
Under format1, there are several reserved captured group names used in this example. time indicates log time, severity activates color coding in GCP Log Viewer and message indicates the log message.
time_format formats values from time so that GCP Log Viewer can convert the UTC timezone to the local timezone.
Custom captured group names can also be used, and they will appear in under jsonPayload in GCP Log Viewer, ex:-
{
  insertId: "6un3n1flz5dd3y2pv"
  jsonPayload: {
    class_line_num: "o.j.x.c.h.XrayHeartbeatImpl:55"
    thread: "http-nio-8081-exec-8"
    trace_id: "42998b6c3c8d8a8"
  }
  labels: {…}
  logName: "projects/ml-mps-cpl-ajfrog-p-ea94/logs/jfrog_artifactory%2Fartifactory_service_log"
  receiveTimestamp: "2020-06-20T23:46:45.123156405Z"
  resource: {…}
  severity: "INFO"
  timestamp: "2020-06-20T23:46:43.188Z"
}
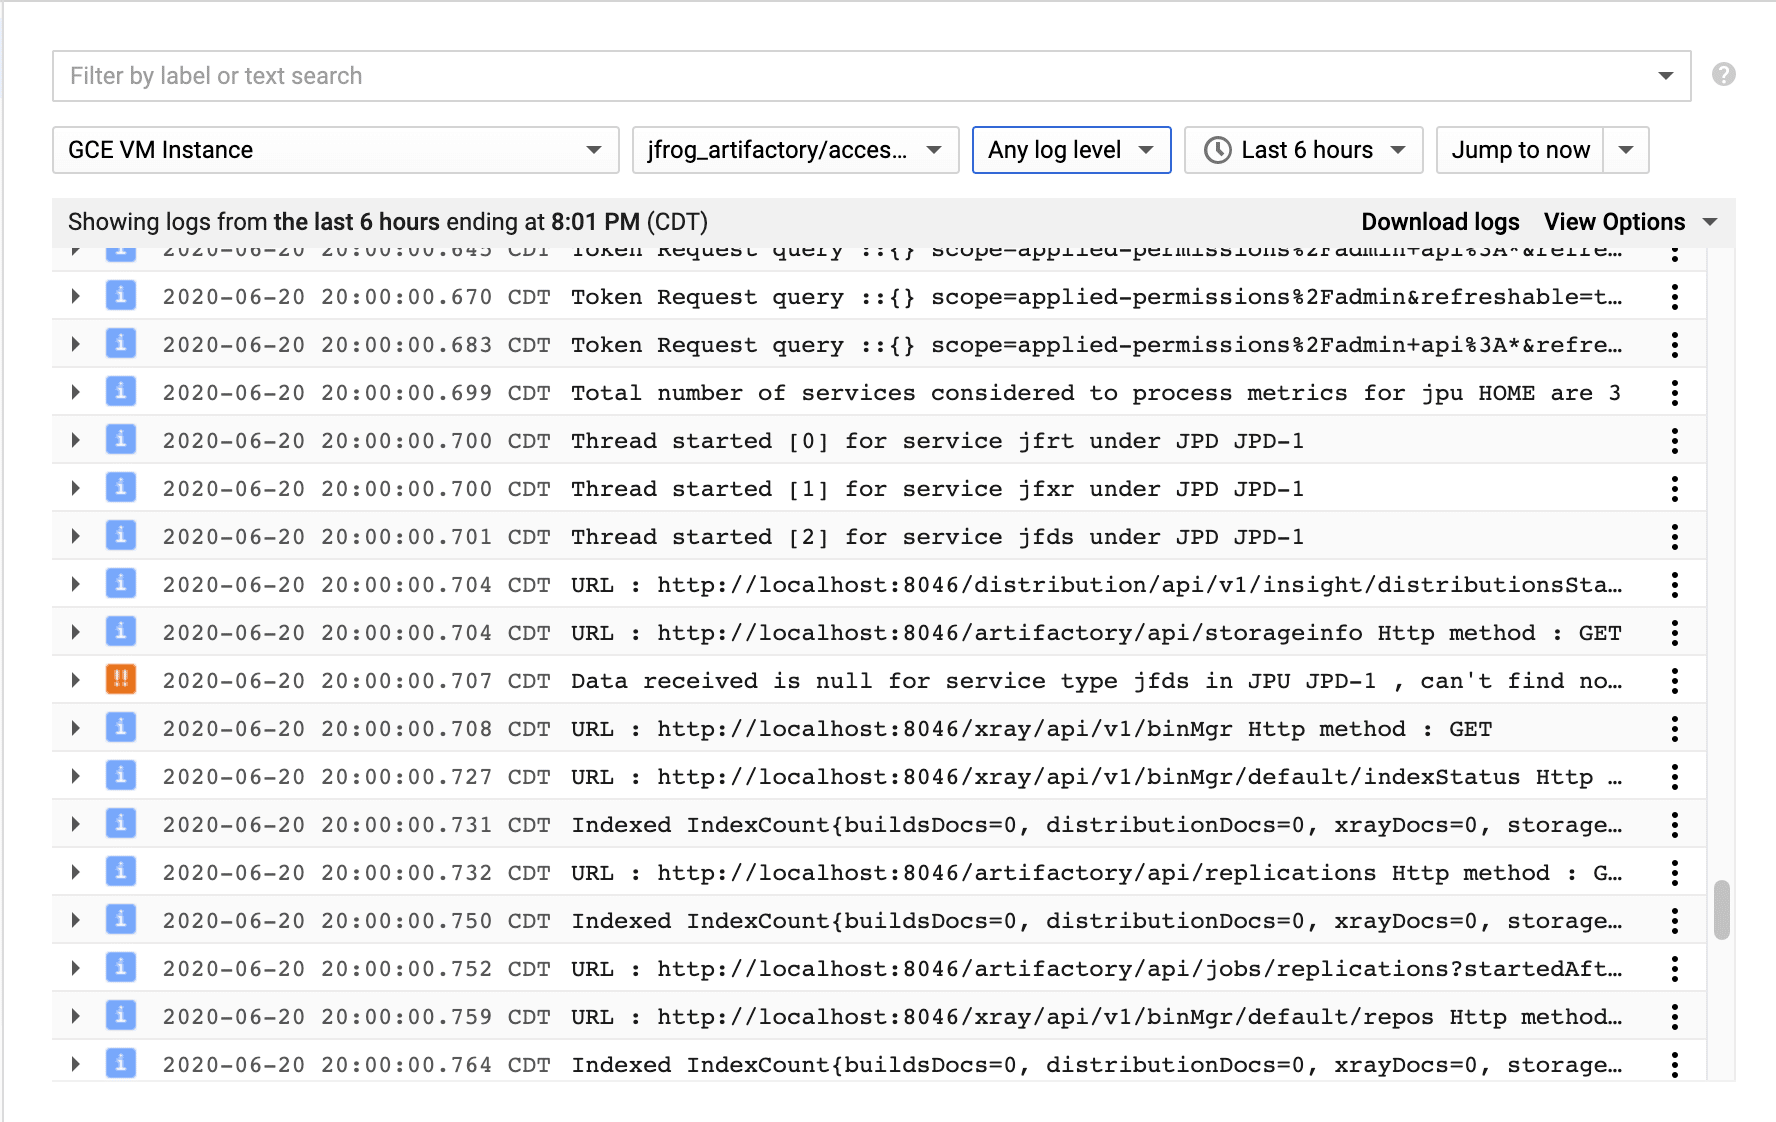
Here’s an example of a fully converted structured logging in GCP Log Viewer:-
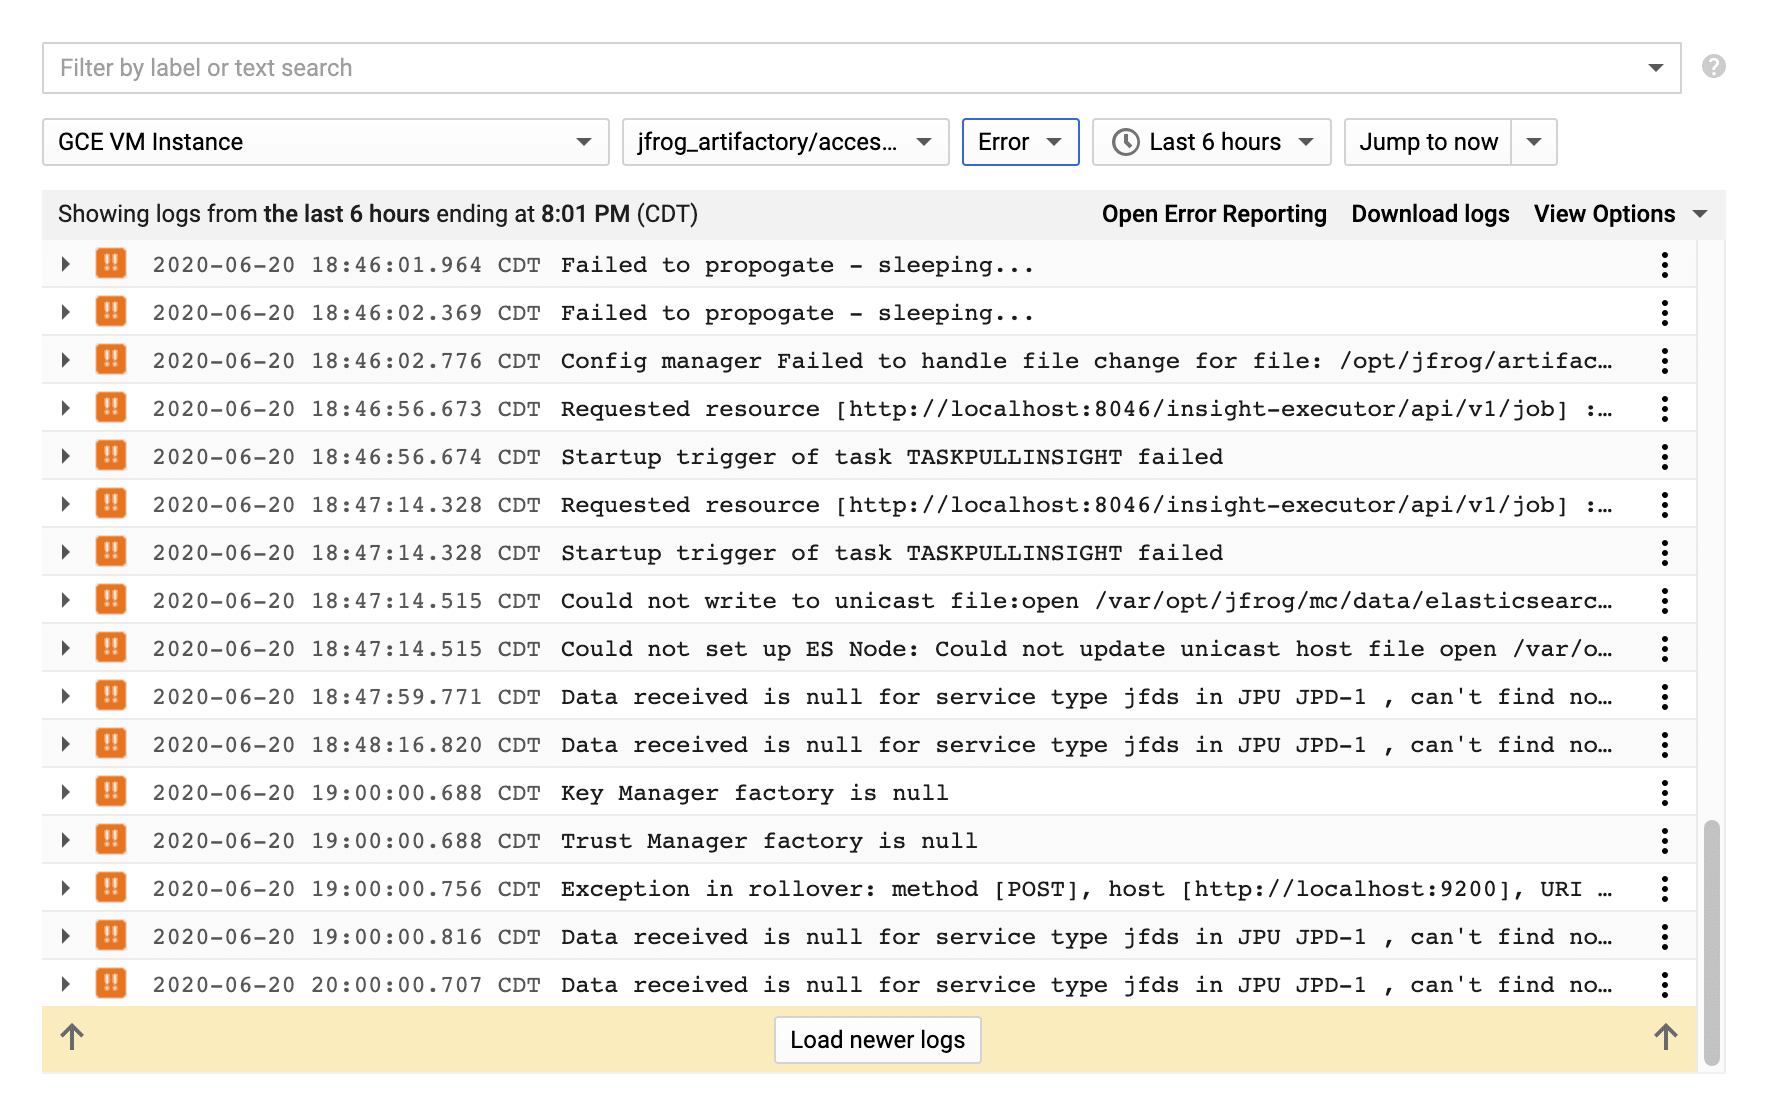
Now, we can easily filter the logs by severity:-
A COUPLE OF HELPFUL TIPS
Building Regular Expression
Building a robust regular expression is very painful, but you can use tools such as https://regex101.com to construct and test the regular expressions first before pasting in the config file.
Checking for Errors
When tweaking the config file, the quickest way to verify the correctness of it is to restart the service. Then, run this command, check for any errors, rinse and repeat:-
tail /var/log/google-fluentd/google-fluentd.log
Speed Up Testing
Instead of waiting for the app to push logs into the log file, you can manually append the mock data to the log file, ex:-
cat <<EOF >>/tmp/myshittycode_structured.log
2020-06-20T20:00:00.107Z [INFO ] - Storage garbage collector report:
Number of binaries:      0
Total execution time:    4 millis
2020-06-20T20:14:25.525Z [INFO ] - Starting to cleanup incomplete Release Bundles
2020-06-20T20:14:25.533Z [WARN ] - Finished incomplete Release Bundles cleanup
2020-06-20T20:31:00.167Z [ERROR ] - Start cleaning expired sessions
EOF
Then, run this command to ensure there are no “pattern not match” errors:-
tail /var/log/google-fluentd/google-fluentd.log
If there are no errors, the logs will eventually appear in GCP Log Viewer.
Leave a Reply