Table of Contents
Problem
This post applies to you if:
- You have an application that performs CRUD operations against GCP BigQuery.
- When you open up your project billing report every month, you notice the BigQuery service is consistently one of the biggest spenders.
- You have no idea why the BigQuery cost is so high.
- You cannot explain the rising cost to your boss other than saying, “The database is called BigQuery, so the query must be big!”.
Solution
The GCP billing report can tell us the cost breakdown of the services used over time, but it cannot tell us why it costs this much. To get the whys, we need to pull additional data to paint a fuller picture.
Filtering the Logs
There are several ways to find out what queries are hitting your BigQuery tables/views and how many bytes are billed. In this post, we will use Log Explorer because it takes the least work to get the bird’s-eye view.
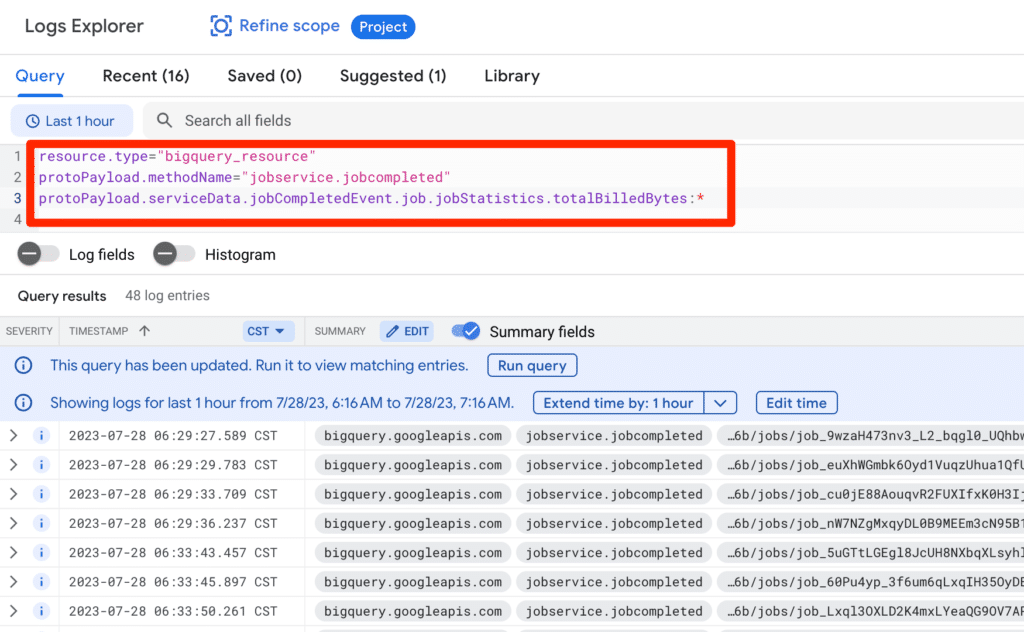
In the Log Explorer query box, enter the following:
resource.type="bigquery_resource"
protoPayload.methodName="jobservice.jobcompleted"
protoPayload.serviceData.jobCompletedEvent.job.jobStatistics.totalBilledBytes:*
The first 2 lines filter all the BigQuery completed jobs. The third line filter jobs that cost money.
When running the above query, the result looks like the following:
Making Metrics Easier to Read
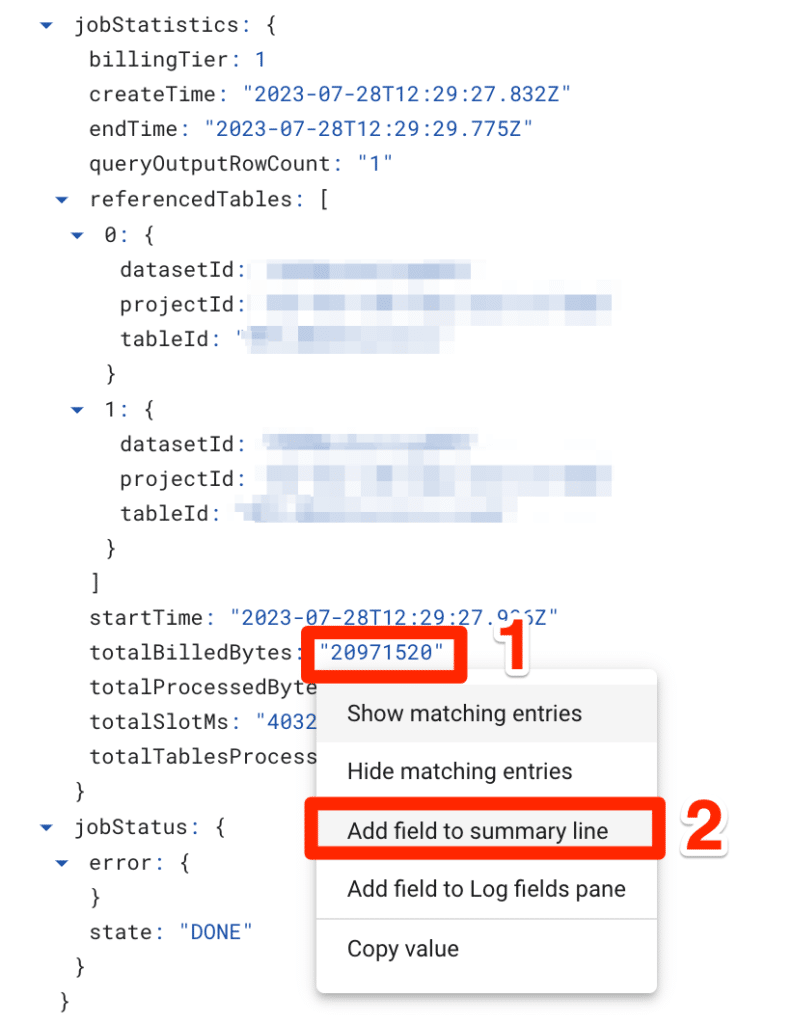
From this view, it’s difficult to see the total bytes billed for each completed job by default, and it’s easier to scan for these values by bubbling them up. To do this:
- Click on any result item, and expand the payload.
- Under jobStatistics, locate totalBilledBytes.
- Select the value, and select Add field to summary line.
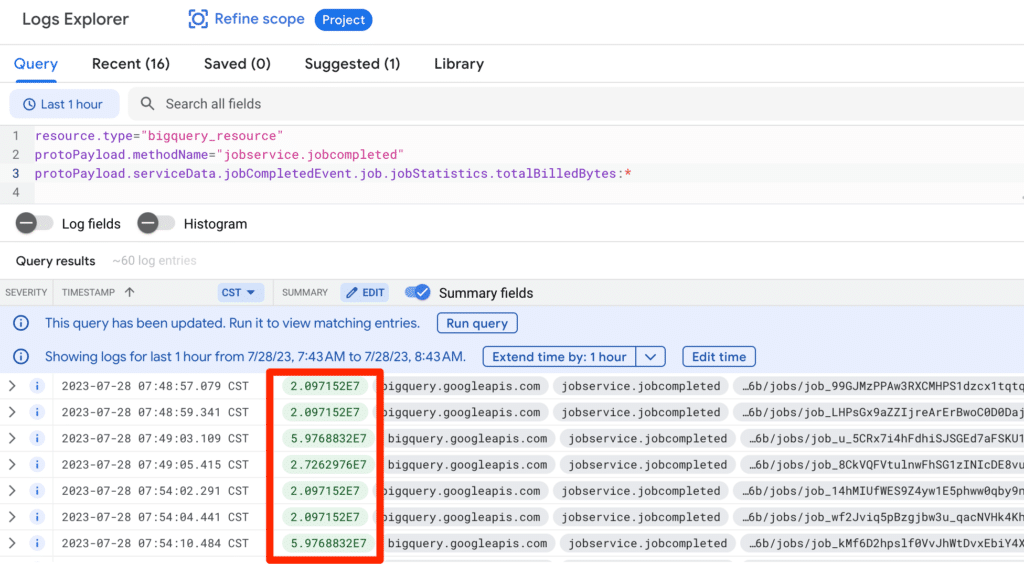
Now, the log result displays the total bytes billed in green, where you can scan for any large numbers that interest you.
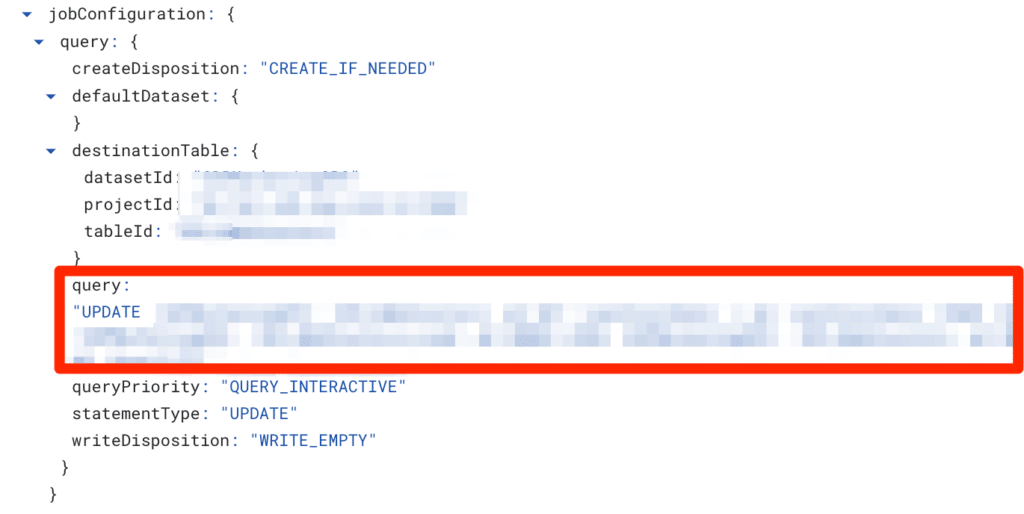
Inspecting Executed Query
From here, you can jump into the payload in question and search for the executed query:
This approach is also great for detecting patterns in the logs. If the logs show the same total bytes billed every X minutes, it is almost likely executed by a scheduled process instead of interactively by the end users. Then, ask yourself, “If the query is returning the same 100 GB of data every 10 minutes, is this the most effective solution? Or can the result be stored in L2 cache (ex: Redis, etc.)?”.
Leave a Reply